I have two monitor for 2 different pages, One of them is not showing right url content. Hence it is monitoring wrong data. can you please check ?
the monitored data is defined by the selections. what selections do you see when using the visual selector for this monitor? see What is Visual Selector? – Distill to learn more
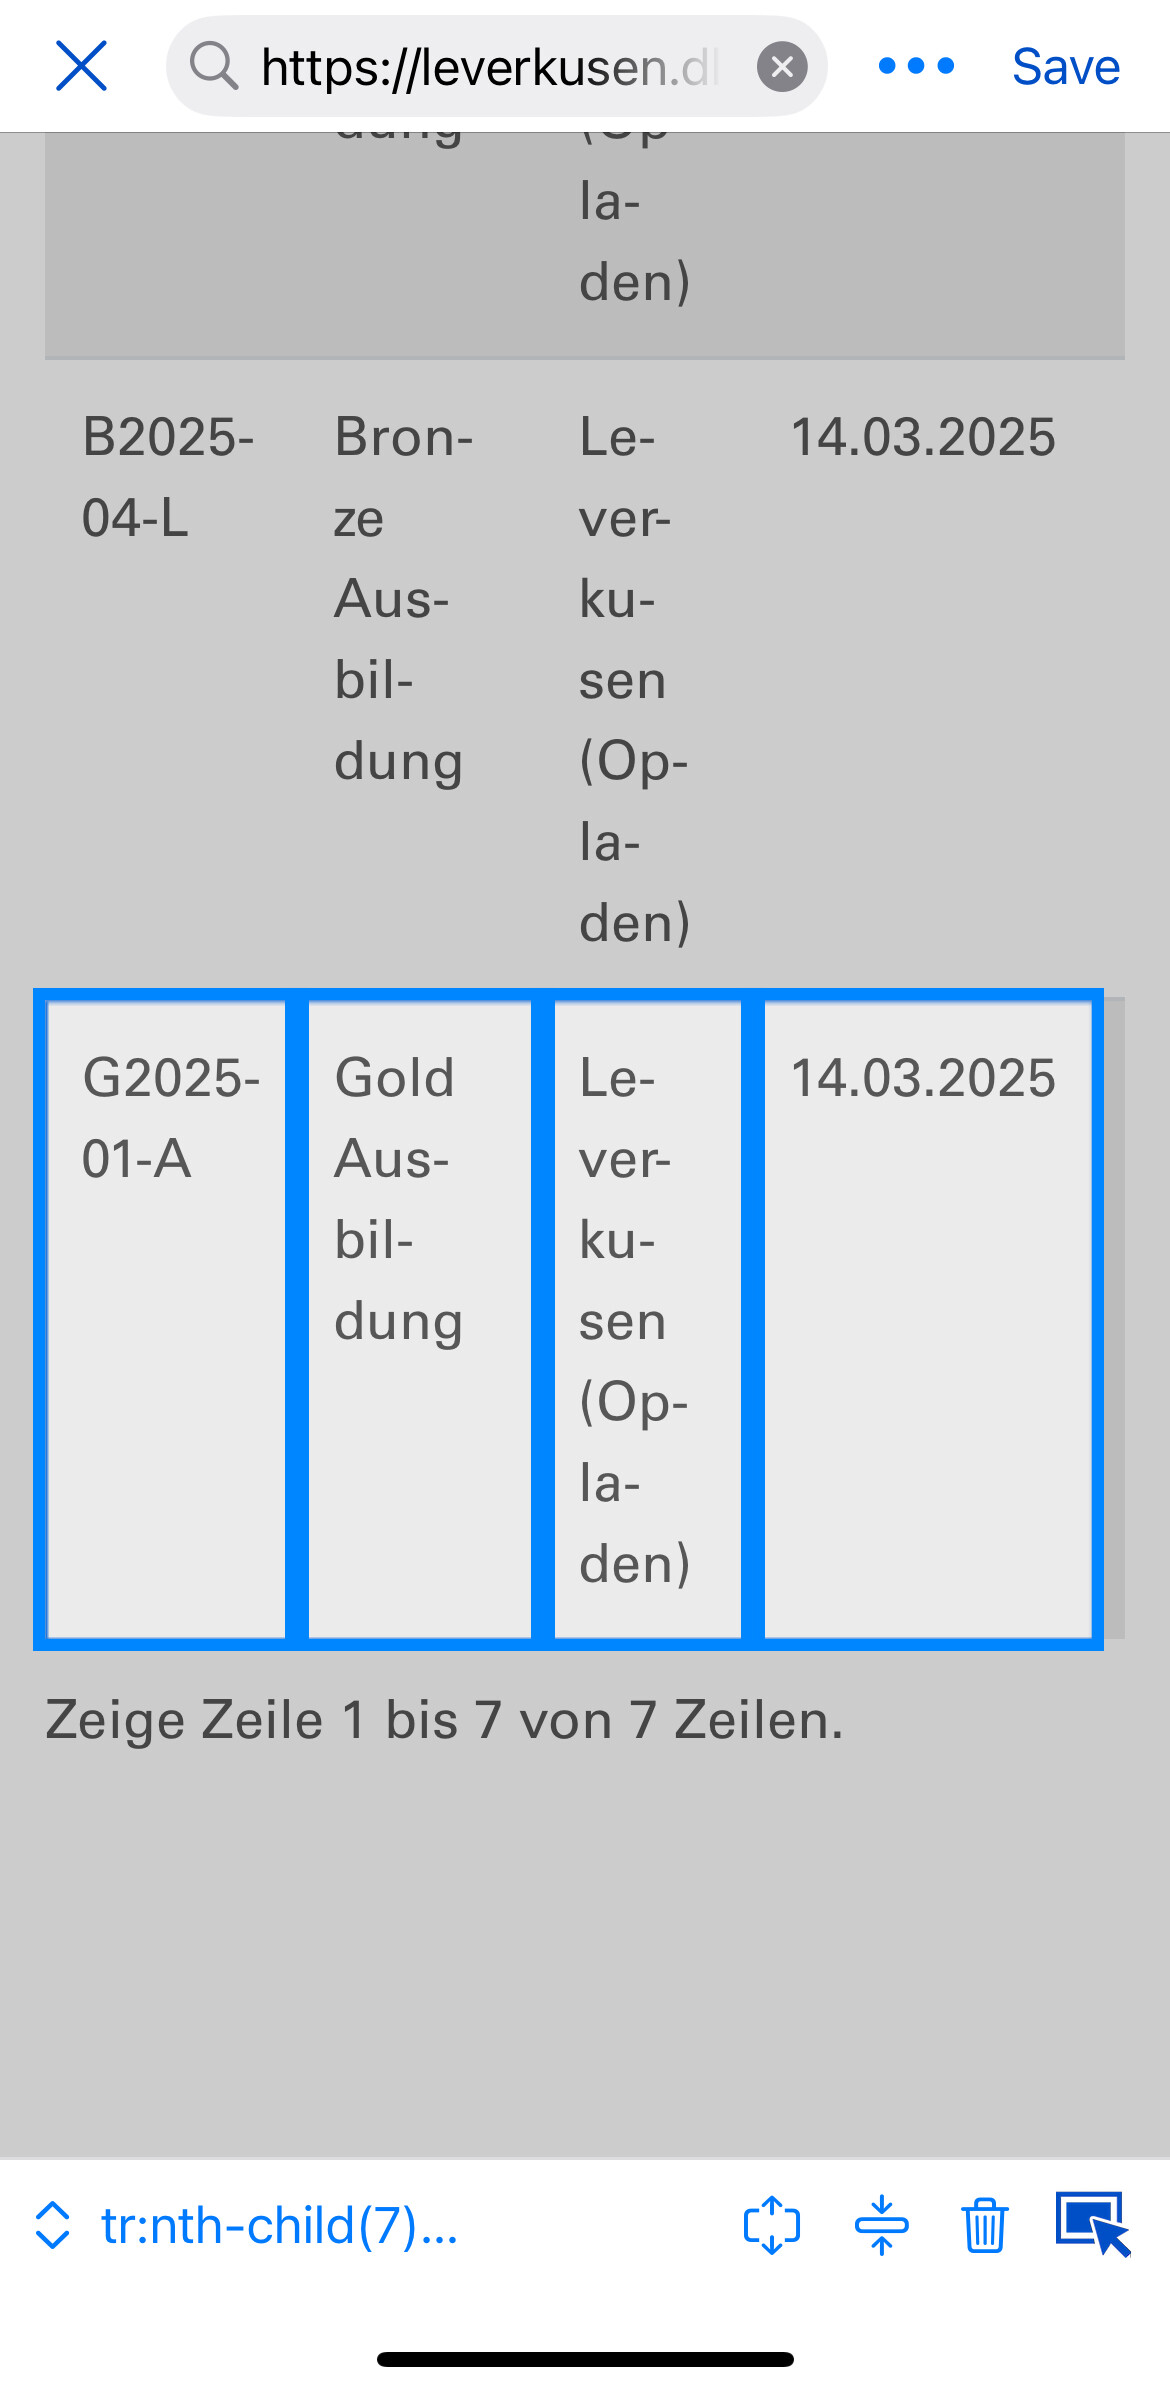
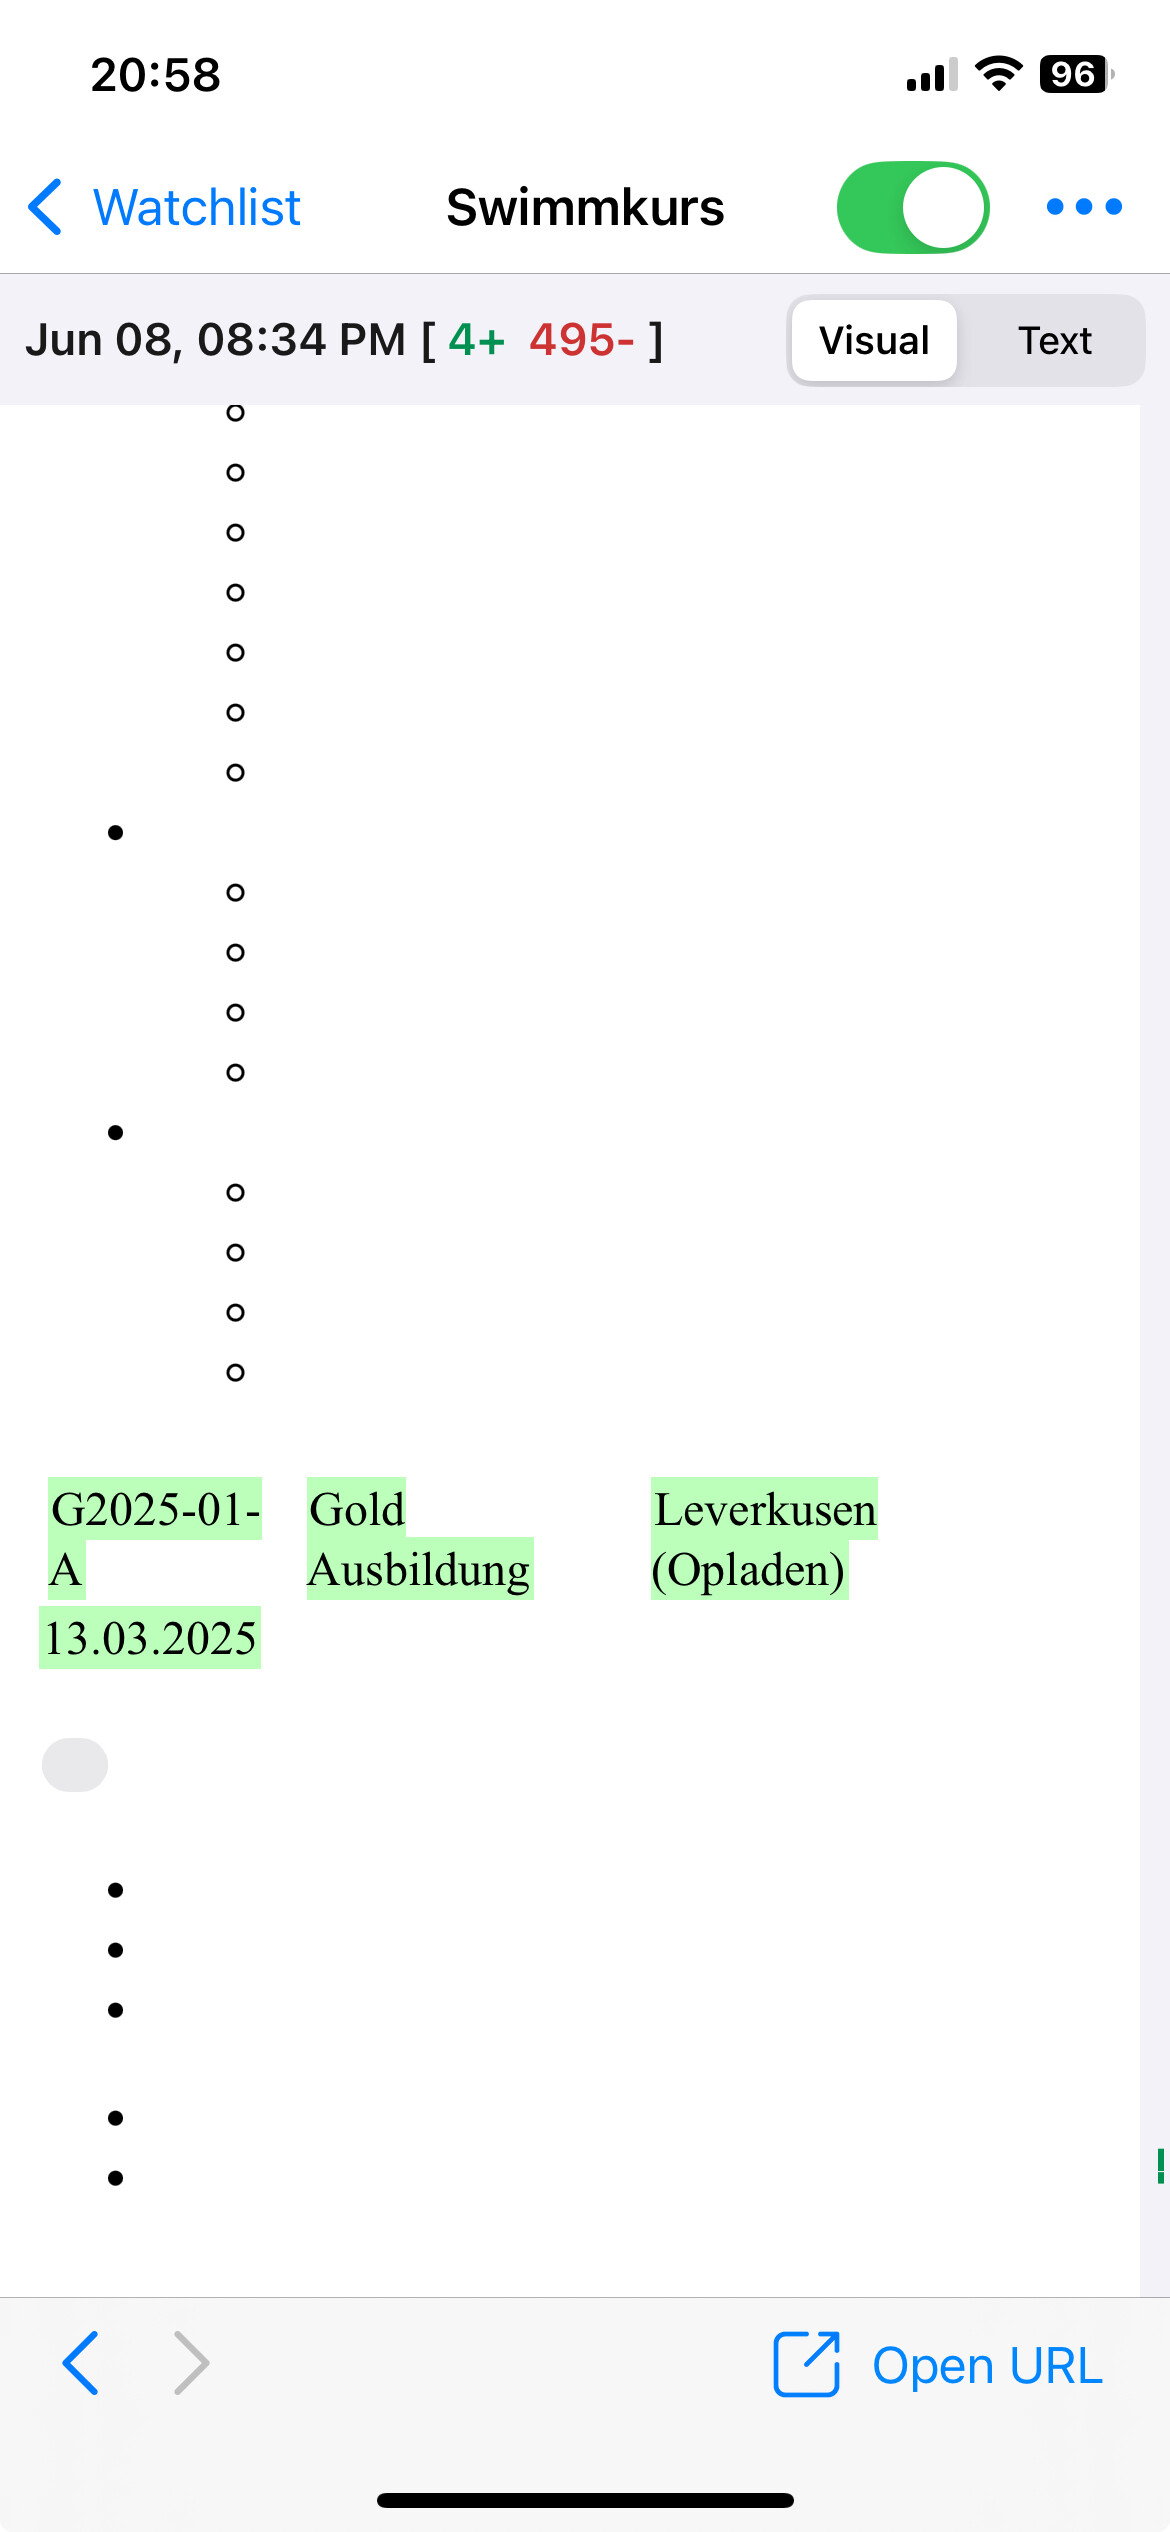
I have changed it again today and selector is covering right area for monitoring on the page . But it shows wrong information. One of the content on selected area is a date. Date on website is 14.03.2025 and when I check the visual selector it shows 13.03.2025. When I did initial configuration webpage had 14.03.2025 and now it shows wrong after I save the monitor settings.
Change History shows this :
1 Like
i think i understand what could be happening now. the difference in the dates is most likely because of difference in timezone. websites usually show time in the computer’s timezone or in utc.
all cloud checks happen in the est timezone (utc -5:00 right now). the page most like shows the date as 13.03.2025 in est. you can verify this by changing your pc’s/phone’s timezone temporarily to utc -5:00? if you can share the url, i can verify this too.
note that the visual selector’s remote browsers used by the visual selector can use browsers from different timezones.
This sounds reasonable root cause.
Can you please do me a favour and test in your timezone : Jugendschwimmabzeichen | DLRG Bezirk Leverkusen e.V.
it does - 13.03.2025 is displayed in est but 14.03.2025 in cest.
note that it won’t affect monitoring result. alert will be triggered as soon as a change is detected.